

We may receive a commission from our partners if you click on a link to review or purchase a product or service. Click to Learn More
Tools such as monday CRM let users track sales progress by recording activity, surfacing patterns, flagging at-risk deals, and generating forecasts in real time.
Without a structured way to track sales progress, deals slip through the cracks, performance gaps stay invisible, and revenue forecasts become guesswork.
Sales tracking fixes that, giving your team a shared, accurate view of what’s working, what’s not, and where to focus next.
- Sales tracking gives teams a real-time view of pipeline health, deal velocity, and rep performance, which is the foundation for consistent, predictable revenue growth.
- Defining a clear sales pipeline with standardized stages is what makes data collection meaningful.
- Software like monday CRM can boost sales by 29%, productivity by 34%, and forecast accuracy by 42%, making it the most high-impact investment a sales team can make in their tracking process.
- AI features like deal probability scoring, predictive forecasting, and automated activity logging, available in monday CRM, remove the manual effort from tracking so teams can focus on selling.
- Businesses with data-driven sales strategies grow their marketing reach by 15% to 20%, but that only happens when insights are shared across teams.
What Is Sales Progress Tracking?
Sales progress tracking is the of collection, quantification, and analysis of pipeline data to monitor performance, identify bottlenecks, and drive revenue growth.
To track sales correctly, you’ll need to know which sales performance metrics are most important and how to use them.
How To Track Sales Progress
Modern software can automate your sales tracking, saving you hours each week on admin work. To set up this process, you need to:
- Define your goals and process
- Set up your CRM tracking dashboard
- Customize based on your needs
- Turn insights into reports and forecasts
- Share reports with your team
1. Define your goals and process
Establish what your team is working toward. A good sales goal is specific and ambitious enough to push performance, but realistic enough to be achievable.
Common goals include:
- Grow total revenue
- Increase number of closed deals
- Raise average deal size
Then, map out the steps your team takes to move a deal from first contact to close. This is your sales pipeline, and it typically includes stages like:
- New deal
- Qualifying meeting
- Demo
- Proposal
- On hold
- Closed
monday CRM’s pipeline conversion chart tracks each of these stages and visualizes where leads are most likely to drop off, which is a critical insight for improving your sales lead generation process.
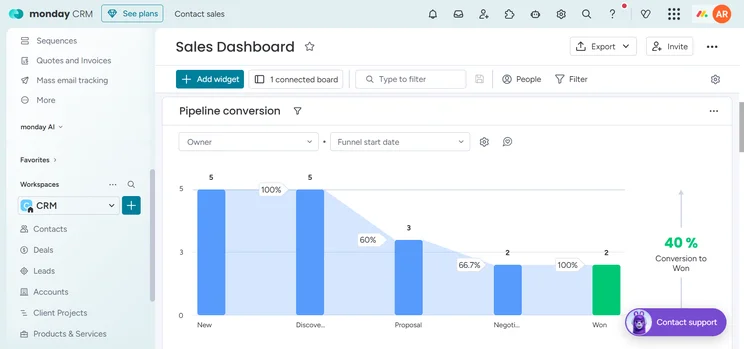
The monday CRM pipeline conversion chart tracks sales pipeline stages to visualize where there are the most drop-offs. Source: Tech.co testing
2. Set up your CRM tracking dashboard
You need a CRM platform to quickly and easily track sales data. These tools organize your pipeline stages into groups and pull all activity into a central analytics dashboard.
monday CRM is highly easy to use, so onboarding new users and supplying the platform with customer data takes up to three days.
The monday CRM Sales Dashboard is built around drag-and-drop widgets that surface key sales data, including:
- Annual or monthly sales numbers, actual versus target
- Average deal value in dollars
- Forecasted revenue on active deals
- Deal status distribution, showing the percentage of deals proposed, in progress, worked on, or won
Other standout monday CRM AI features include monday sidekick, which answers questions about your pipeline, summarizes deal activity, and surfaces deals that need attention.
monday agents can automate data collection, flag stalled deals, and update your boards in the background.
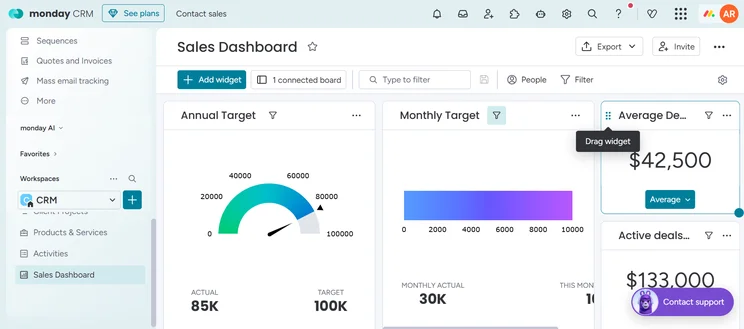
monday CRM’s sales dashboard includes a drag-and-drop interface editor. Source: Tech.co testing
3. Customize based on your needs
CRM dashboards are fully customizable. Once live, they auto-populate with your chosen data.
With monday CRM, you can create new dashboard templates, rearrange widget order, or drag the Pipeline conversion bar chart to the top so it’s the first thing you see each day. Every chart, graph, and stat widget is editable via the settings option.
Businesses with data-driven sales strategies grow their marketing reach by 15% to 20%, but getting there requires knowing what to do with your data.
monday sidekick can generate revenue projections, draft product pitches, write onboarding guides, and reorganize your boards based on natural language prompts.
The Lead Agent can prioritize which deals deserve immediate attention, while the Competitor Research Agent keeps your team informed on market shifts that could affect your pipeline.
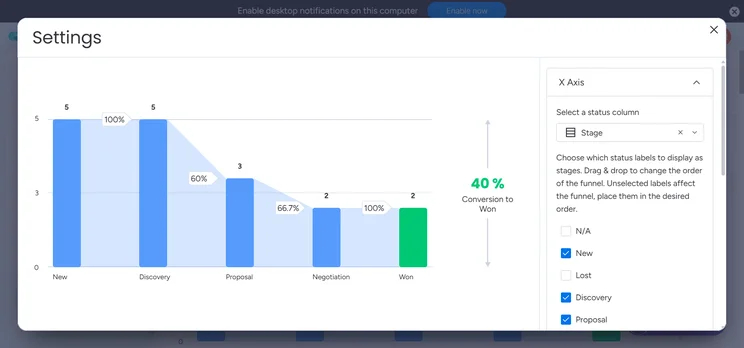
monday CRM lets users customize all charts, graphs, or statistics widgets. Source: Tech.co testing
4. Turn insights into reports and forecasts
Once you’ve collated your data, you should build reports that analyze your data reveal actionable, practical results.
monday CRM lets you schedule regular PDF exports of your sales dashboard, building a library of historical data over time.
You can also use pre-built report templates to standardize how performance is reviewed across your team.
monday CRM’s built-in AI uses predictive tools to generate deal probability scores, demonstrating the likelihood of each deal closing and helping reps focus their energy where it counts most.
monday sidekick can produce revenue projections, batch-send messages via integrations like RingCentral, and draft reports based on your live board data.
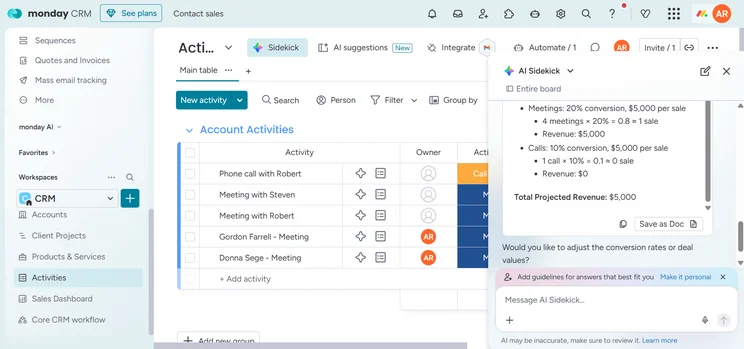
Within minutes, AI Sidekick generated a sample revenue projection that is downloadable as a doc file. Source: Tech.co testing
5. Share reports with your team
Make sure your insights reach the relevant stakeholders. Whether you schedule a recurring meeting or send a summary bulletin, the goal is to get your team actively responding to what the data is telling them.
Review sales metrics monthly for tactical adjustments and quarterly for strategic shifts. monday CRM’s Deal Insights widget simplifies this by flagging deal health based on positive or negative signals that you define.
Logging activity is just as important as sharing it. monday CRM captures every client interaction, including calls, emails, and meetings, giving your team a complete and accurate record to work from.
Combined with AI features like the AI Notetaker, email summarization, and AI email generators, logging interactions takes minimal effort, which means your reports reflect the full picture.
U.S. Bureau of Labor Statistics data projects a 21% growth rate for operations research analyst roles through 2034, a signal that demand for data-driven decision making is only increasing.
The teams best positioned to take advantage of that shift are the ones building strong data habits now.
Why Is Sales Progress Tracking Essential for Growth?
Tracking sales progress enables organizations to expand market share, close efficiency gaps, and increase revenue by optimizing each stage of the deal lifecycle.
Surface profitable markets
Tracking reveals correlations you might otherwise miss. Suburban sales may spike during school breaks, or B2B buyers may spend more in December before their annual budget resets.
Improve decisions on other teams
Sales insights extend well beyond the sales team. Marketing learns which offers resonate with specific audiences; product and design teams build solutions tailored to real customer needs.
Cut down expenses
Data exposes hidden costs. A high drop-off rate at the qualification stage, for example, might signal a need to shift to a more cost-effective outreach strategy.
Harvard Business School research shows that data-driven programs designed to reduce costs successfully achieve their financial goals for 49% of participating companies.
Big-picture understanding
Individual data points tell a partial story. Together, they reveal broader trends and behaviors that help teams optimize processes, spot patterns early, and identify where automation can have the most impact.
Which Sales Metrics Should I Track?
The most important metrics to track are sales velocity, customer acquisition costs, and lead drop-off points, but a complete picture requires looking across several dimensions of performance.
- Sales velocity
- Customer acquisition cost (CAC)
- Lead drop-off point
- Sales rep performance
- Tactic success/fail ratio
Tracking sales progress comes down to three things: understanding your process, capturing the right data, and turning that data into decisions your team can act on.
The right platform makes all of this significantly easier. monday CRM gives teams a centralized place to manage their pipeline, automate data collection, and access AI-powered insights that surface what matters most, from deal probability scores to real-time forecasts.
Getting started with the right tool is the first step toward building the kind of data habits that drive consistent, predictable revenue growth.
FAQs
Start by answering three questions: what goal or decision do you need to reach, what data is essential to get there, and what collection method is realistic right now. For most small teams, the KPIs that matter most are win rate, deal size, total pipeline value, sales cycle time, and revenue won. monday CRM makes it easy to track all of these in one dashboard, even if you are just getting started.
Customer satisfaction can be tracked through metrics like Net Promoter Score (NPS), customer retention rate, repeat purchase rate, and post-sale feedback. These indicators help surface trends in how satisfied customers are with both the product and the sales experience.
For long-term revenue potential, focus on metrics like customer lifetime value (CLV), pipeline value, deal velocity, upsell and cross-sell rates, and churn rate. These give you a forward-looking view of your revenue trajectory beyond just current closed deals.


