

We may receive a commission from our partners if you click on a link to review or purchase a product or service. Click to Learn More
Understanding your stakeholders is a crucial part of project management. If you don’t carefully manage stakeholders and their concerns and expectations, you risk generating backlash to your project, facing delays, or creating a product that end-users don’t want.
This is where stakeholder mapping can help. It’s a way to visualize your stakeholders and prioritize them based on their importance to your project.
This guide explains what stakeholder mapping is and how you can use it to build an effective stakeholder management strategy.
Key Takeaways
- Stakeholder mapping is a way to visualize your project’s stakeholders and their relative importance.
Stakeholder mapping is important for any large project with multiple stakeholders and can help you build an effective stakeholder management plan. - There are several visualizations you can use to map stakeholders, including an interest vs. influence matrix, a RACI chart, and a salience model.
What Is Stakeholder Mapping?
Stakeholder mapping involves creating a visual representation of the stakeholders around a project. It’s a useful approach for large projects that involve multiple stakeholders with varied needs, concerns, and expectations.
Stakeholders can include any individual or group that has influence over your project or is impacted by it, such as your company’s executive team, investors, and end-users or customers. A stakeholder map can include both internal and external stakeholders.
The ultimate goal of stakeholder mapping is to help project managers assess which stakeholders are most important to a project’s success. You can use the information from a stakeholder map to create a plan for engaging and managing each stakeholder.
Common Types of Stakeholder Maps
Let’s take a look at three of the most common stakeholder visualizations and how you can use them.
Interest vs. Influence Matrix
An interest vs. influence matrix plots stakeholders’ interest or involvement in your project against their level of influence on your project’s outcome. You can divide your matrix into four quadrants:
- High interest, high influence: Stakeholders in this quadrant are the key players in your project. They should be closely managed and kept up-to-date on your project.
- High interest, low influence: These project stakeholders are excited about your project but have limited power over it. Although they should be kept informed, they don’t need to be involved in key decisions.
- Low interest, high influence: These are decision-makers who need to approve important aspects of your project. They should be kept satisfied but don’t need to be actively engaged.
- Low interest, low influence: These are low-priority stakeholders. Monitor their needs, but don’t spend significant resources managing them.
RACI Chart
A RACI chart is a bullseye-style chart of four concentric circles labeled responsible, accountable, consulted, and informed. The circles represent different degrees of engagement that relevant stakeholders have with your project.
Stakeholders in the responsible circle (the center of the bullseye) are highly engaged partners who participate directly in your project. Stakeholders in the accountable circle are decision-makers who may need to sign off on project components. Those in the consulted circle can provide input on decisions but don’t have decision-making power. Lastly, those in the informed circle are low-priority stakeholders who should be updated as the project progresses.
When using a RACI chart, it’s a good idea to color-code or size symbols for each stakeholder according to their influence or importance. That way, it’s easy to pick out the most important stakeholders in each group.
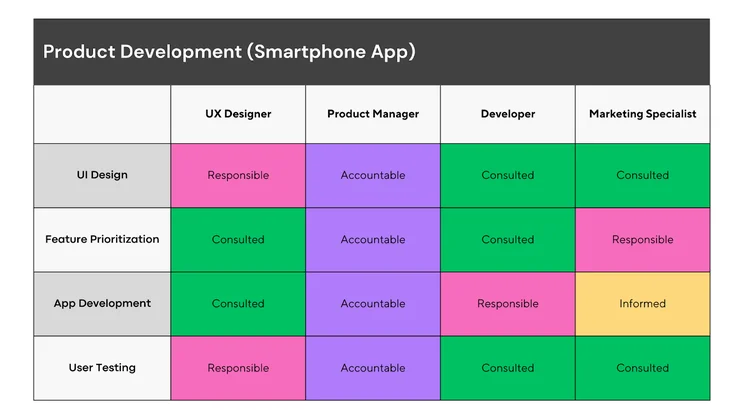
An example of a RACI chart a team developing a Smartphone might build.
Salience Model
The salience model consists of a three-circle Venn diagram, with the three circles representing legitimacy, power, and urgency.
Legitimacy indicates that a stakeholder is directly impacted by your project. Power reflects how much influence a stakeholder has over your project. Urgency reveals how strongly a stakeholder feels about their concerns.
This model divides stakeholders into seven groups:
- Dormant: High legitimacy, low power, low urgency
- Discretionary: Low legitimacy, high power, low urgency
- Demanding: Low legitimacy, low power, high urgency
- Dominant: High legitimacy, high power, low urgency
- Dangerous: Low legitimacy, high power, high urgency
- Dependent: High legitimacy, low power, high urgency
- Definitive: High legitimacy, high power, high urgency
Stakeholders in the definitive group are the key stakeholders for your project, while those in the dominant, dangerous, and dependent groups are secondary stakeholders. Stakeholders in the dormant, discretionary, and demanding groups are the lowest-priority stakeholders.
Stakeholder mapping offers a way to visualize the relative importance of stakeholders around your project. As we’ve discussed, there’s more than one way to approach this task, and which one is the most suitable will likely depend on the remote of your project, who precisely is involved, and the reporting structures that currently exist within your business.
Whichever approach you choose, stakeholder mapping is an essential step in developing a stakeholder management plan and can help ensure you get the support needed for your project to succeed, so it’s definitely worth making time for.
FAQs
Before creating a stakeholder map, you must identify your project’s stakeholders. Think carefully about who has the decision-making power or information you need, who will be impacted by your project, and who your project’s end-users are.
The two key variables that the stakeholder mapping process helps you visualize are stakeholder interest and influence. Interest describes how engaged a stakeholder is with your project, while influence describes the level of decision-making power a stakeholder has over your project.


