

We may receive a commission from our partners if you click on a link to review or purchase a product or service. Click to Learn More
In our opinion, ClickUp is the best software for building Gantt charts, because of its easy-to-use and intuitive display, drag-and-drop functionality, and real-time updates. Plus, you’ll be able to access Gantt charts without paying a dime — it’s all available on the free plan.
Another great option for businesses is Teamwork, which is perfect for businesses looking for strong collaboration tools across projects. And, businesses on a budget can’t go wrong with Zoho Projects, which offers a wide range of integrations and an entry fee of only $4 per user, per month.
In this guide, we break down the best Gantt chart software providers, based on our experience getting hands-on with each platform. We also explore each provider’s wider project management uses, and give tips on how Gantt chart software can help your business.
- ClickUp is our top choice for Gantt chart software. With over 11 project views and solid free plan availability, ClickUp is the perfect all-round choice for businesses looking to manage projects.
- Teamwork is another solid option for businesses prioritizing collaboration tools, as well as its intuitive drag-and-drop functionality and good-looking design.
- Businesses on a budget should opt for Zoho Projects, which starts at only $4 per user, per month, and offers plenty of third-party integrations.
- We would recommend opting for a dedicated project management software rather than a dedicated Gantt chart platform, as this will give businesses access to a wide range of features, including third-party integrations and custom views such as Kanbans, outside of just Gantt charts.
- In order to choose the Gantt chart software for your business, you should consider your budget, team size, plan availability, and individual features.
- All of our recommendations are based on our extensive user-testing process.
Best Gantt Chart Software
At Tech.co, we test all the products we review, and project management software is no different.
Below, we’ve listed our top project management software providers, and you can see which ones provide Gantt charts — as well as whether they’re available on the provider’s free plans.
- ClickUp – Best all-round Gantt chart
- Teamwork – Best Gantt chart for collaboration
- Zoho Projects – Best Gantt chart on a budget
- Jira – Best Gantt chart for data visualization
- monday work management – Most customizable and visually appealing Gantt chart
Click the links above to jump to our reviews of each software.
|
Price from
All prices listed as per user, per month (billed annually)
|
Gantt chart
|
Gantt chart on free plan?
|
Pros
|
Cons
|
Verdict
|
||
|---|---|---|---|---|---|---|---|
|
GREAT VALUE
 |
BEST OVERALL
 |
 |
 |
 |
|||
|
ClickUp |
monday work management |
Teamwork |
Jira |
Zoho Projects |
|||
|
$7/user/month |
$9/user/month |
$9.99/user/month |
$7.91/user/month (300 users) |
$4/user/month |
|||
|
|
|
|
|
|
|||
|
|
|
|
|
|
|||
|
|
|
|
|
|||
|
|
|
|
|
|||
|
Powerful, feature-rich software suitable for teams of all sizes, with an impressive free tier for individuals and a great value plans for teams |
Incredibly easy to use, great for small businesses, and our top-performing provider on test — and there’s a generous free trial period |
A great user experience all round, with an easy-to-use automation builder and great budget tracking capabilities |
A great value piece of software that’s ideal for tech, software development, and engineering teams |
A solid project management solution with an attractive free tier for small teams and a very affordable premium plan |
1. ClickUp: Best All-Round Gantt Chart
Gantt chart on free plan? Yes
Auto-populates Gantt chart? Yes
ClickUp is a real all-rounder. With some excellent task management tools, it’s more of a Work OS than the other options on this list, making it a great solution for businesses looking to avoid juggling multiple different software providers.
It would be great for a small design agency, for instance. The creative directors could use it to keep on top of different client briefs, while using ClickUp Chat to communicate instantly with remote freelancers, if required.
ClickUp

In Short
-
Pros
- 11+ ways to view project progress and data
- Useful “Chat” view for collaboration
- Team view for organizing tasks by team member
- Cheaper than monday Work Management or Wrike
- Agile project management features
- Vast number of features, even on cheap plans
-
Cons
- Customizability can be overwhelming to new users
- Not great at compiling project feedback
- Comparatively clunky automation builder
- Slow to load on our tests
Pricing
- Free plan available
- Unlimited: $7/user/month
- Business: $12/user/month
- Enterprise: custom pricing
Images
Why we like ClickUp’s Gantt chart
Although Gantt charts are available on ClickUp’s free plan – you can only view it 60 times a month. However, a good workaround for this would be to save these ‘uses’ for when you need to edit the Gantt chart and then distribute screenshots of it to those that need it when changes are made.
If you’re running a small project though that only has a team of three or four people, this could be perfect for you. However, if you’d rather a platform without these kinds of restrictions, we would recommend Teamwork.
Here are the features of ClickUp’s Gantt charts:
- Real-time updates: As you make changes to your projects, ClickUp will change your Gantt chart accordingly, which saves you and your business time and ensures your chart is always up-to-date.
- Visually appealing and organized workspace: It goes a long way, further than you might think, when a platform actually looks good. Luckily, ClickUp’s Gantt charts are as functional as they are appealing, with a clean, organized design and bold colors.
- Drag-and-drop functionality: This intuitive design feature allowed us to easily move tasks and projects into the necessary spaces during testing.
- Critical path analysis: ClickUp’s critical path analysis feature will automatically calculate, and then highlight, the sequence of tasks that will lead to your project’s being done as quickly as possible. For businesses looking to maximize their efficiency, this tool will come in handy.
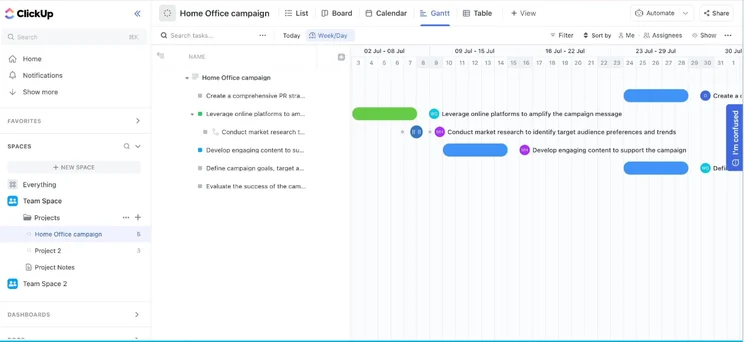
Viewing the Gantt chart on ClickUp. Source: Tech.co testing
ClickUp’s additional features
ClickUp is a great all-round tool for a variety of businesses of different sizes. It’s feature-rich, easy to use, and good value for money, and offers one of the best free plans on the market. It’s not overly blessed with integrations, like Zoho Projects, but that’s simply because it has a lot of stuff in-house.
In our testing, ClickUp also performed great during our ease of use tests. Particularly, we found it really simple to get started with the platform, using preset project management templates and a workflow designer that helps you visualize and organize your automations.
ClickUp pricing
Here are the plans available with ClickUp:
- Free Forever: 24/7 customer support, task management and workflow creation tools, collaboration features.
- Unlimited access ($7 per user, per month): No usage limits on milestones and resource management, no Gantt chart limitations.
- Business ($12 per user, per month): Advanced automations, advanced dashboard features, time tracking, granular time estimates, workload management, timelines, mind maps.
- Enterprise (custom pricing): Onboarding assistance, best suited to larger businesses.
2. Teamwork: Best Gantt Chart for Collaboration
Gantt chart on free plan? Yes
Auto-populates Gantt chart? Yes
Teamwork is actually one of the best task management platforms, and is built for the close monitoring of project progress.
In particular, for businesses where interdisciplinary collaboration is baked into their everyday, Teamwork should be one of the first names on your list.
For instance, if you needed to collate engineering teams, products teams, marketing teams, and sales teams, to track progress as you brought a product to market, Teamwork is a great place to start.
Teamwork

In Short
-
Pros
- Lots of collaboration tools
- Kanban-style boards and Gantt charts available
- Affordable pricing and solid free option
- Great security options
-
Cons
- Limited built-in integrations
- Data visualization isn’t the easiest
Pricing
- Free plan available
- Basics: $9.99/user/month
- Accelerate: $24.99/user/month
- Optimize: custom pricing
- Enterprise: custom pricing
Images
Why we like Teamwork’s Gantt charts
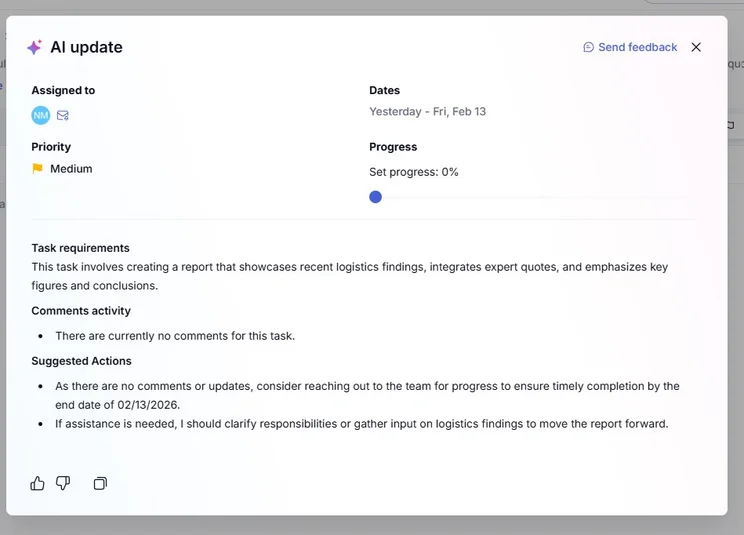
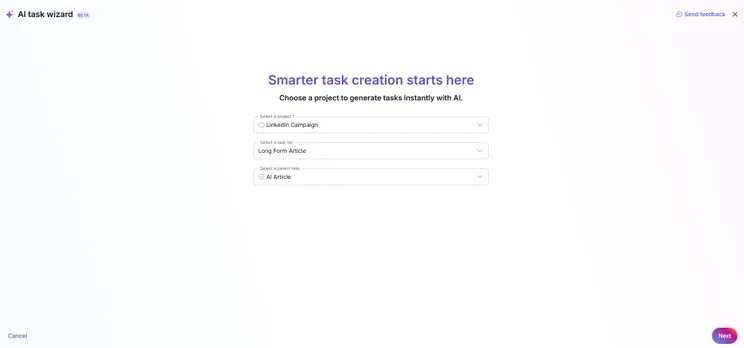
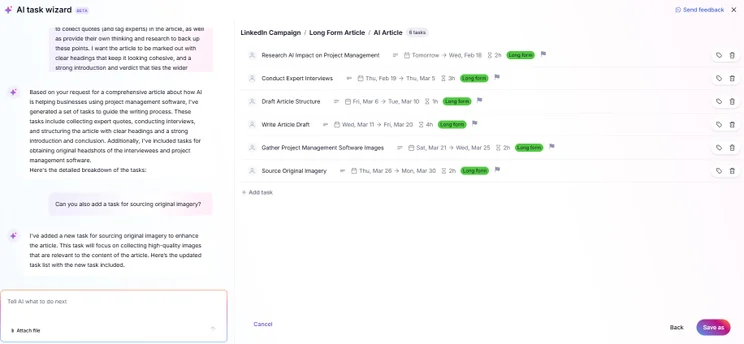
Teamwork, like ClickUp, has Gantt charts available – but unlike ClickUp, there isn’t any limit on the number of times you can ‘use’ the Gantt chart. It’s a super simple Gantt chart to use, and as long as you’ve already inputted your tasks into Teamwork somewhere, then the Gantt chart will auto-populate itself with those tasks.
Here are the features of Teamwork’s Gantt charts:
- Digestible design: Teamwork’s Gantt charts are simple and less cluttered than some of the other providers on our list, making it easy for your business to clearly see how your project is progressing.
- Quickly accessed: It’s pretty simple to view your project as part of a Gantt chart through Teamwork. All we had to do during testing was press ‘G’ on our keyboards while viewing any area of your project to access the Gantt chart view. For businesses that want to quickly access their Gantt chart without having to sift through various menus, this is a massive plus.
- Drag-and-drop functionality: Like ClickUp, Teamwork gives users a way to intuitively navigate areas of their Gantt charts, and we found this made the platform especially easy to use.
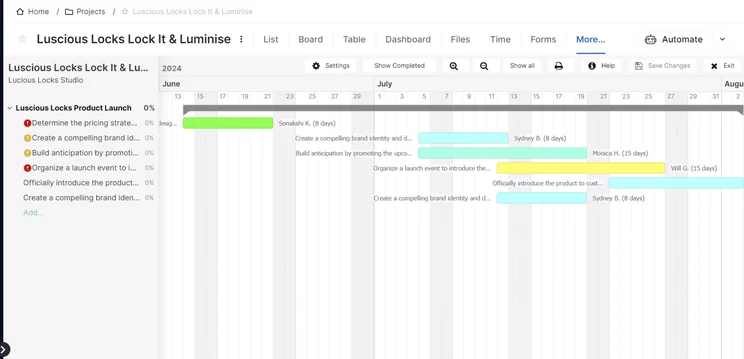
Viewing the Teamwork Gantt chart in action. Source: Tech.co testing
Teamwork’s additional features
Teamwork is great for data visualization, collaborating, and security. Like ClickUp, it isn’t overly blessed with third-party integration options, but that’s another consequence of having a lot of in-built features at users’ disposal.
Likewise, Teamwork’s built-in billing and invoicing features makes it particularly beneficial to businesses managing clients and sales-focused teams.
Teamwork pricing
Here are the plans available with Teamwork:
- Free: Maximum two project limit, five user limit, 100MB storage limit, TeamworkAI. Good for completing one project with a small team.
- Deliver ($10.99 per user, per month): 100GB storage, 300 projects, unlimited users, integrate platforms like Slack and Microsoft teams. Good for small-to-medium-sized businesses that need more than the free package.
- Grow ($19.99 per user, per month): Form builders, CRM functionality, burndown charts, 250GB storage. Ideal for managing more complex projects.
- Scale (custom pricing): 500GB storage, profitability reports, 100,000 automations (per month), budget expenses, and tasklist budget. Geared towards larger enterprises.
3. Zoho Projects: Best Gantt Chart on a Budget
Gantt chart on free plan? Yes
Auto-populates Gantt chart? Yes
Zoho Projects has a free plan that includes a great number of features. In particular, if you’re planning on using or are currently using CRM software during your project, Zoho is a fantastic choice thanks to compatibility apps such as HubSpot and Pipedrive.
In this respect, Zoho is a great solution for scale-up businesses that already have most of their tech and processes entrenched in their day-to-day.
Zoho Projects

In Short
-
Pros
- Paid plans from just $4/user/month
- Team instant messenger for collaboration
- Gantt chart, kanban board, calendar and task dependencies on all plans
-
Cons
- Free plan has no preset or custom project templates
- Teams of more than five will have to pay
- Guest access exclusive to high tiers and costs extra
Pricing
- Premium: $4/user/month
- Enterprise: $9/user/month
- Ultimate: $14/user/month
- Free plan for 5 users
- 15-day free trial
- $1/month off for annual contract
Images
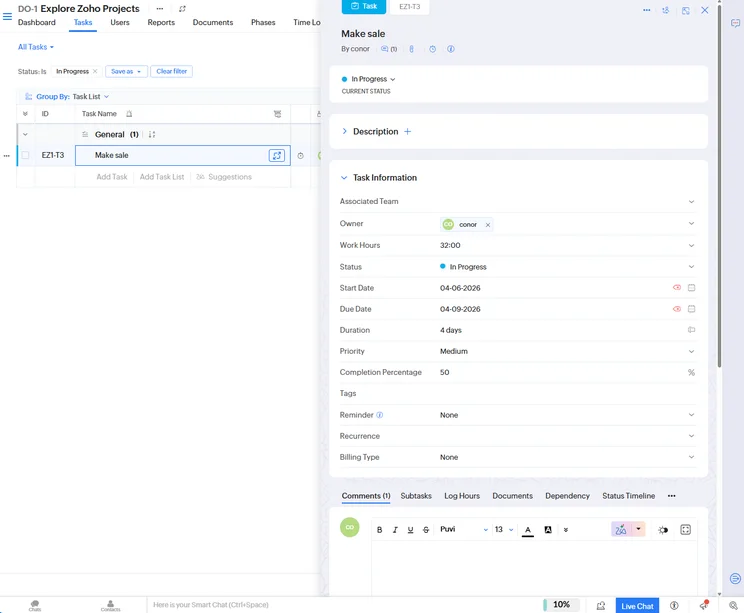
Why we like Zoho Projects’ Gantt charts
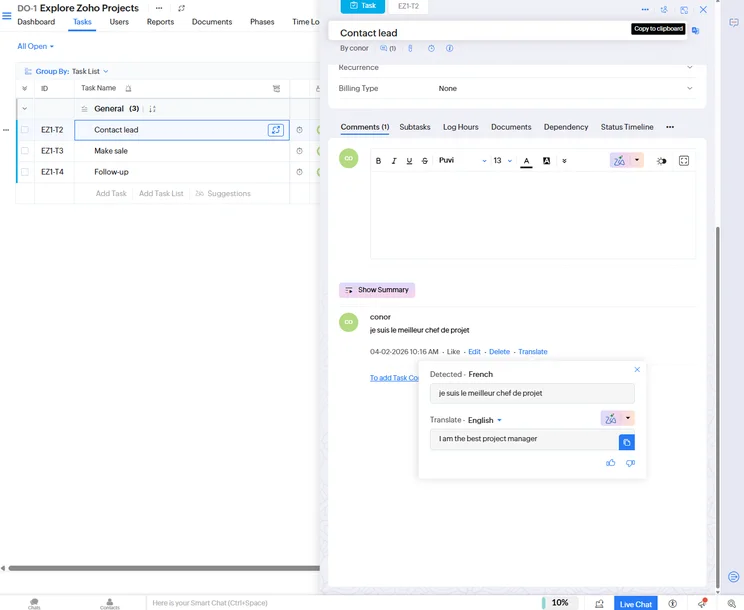
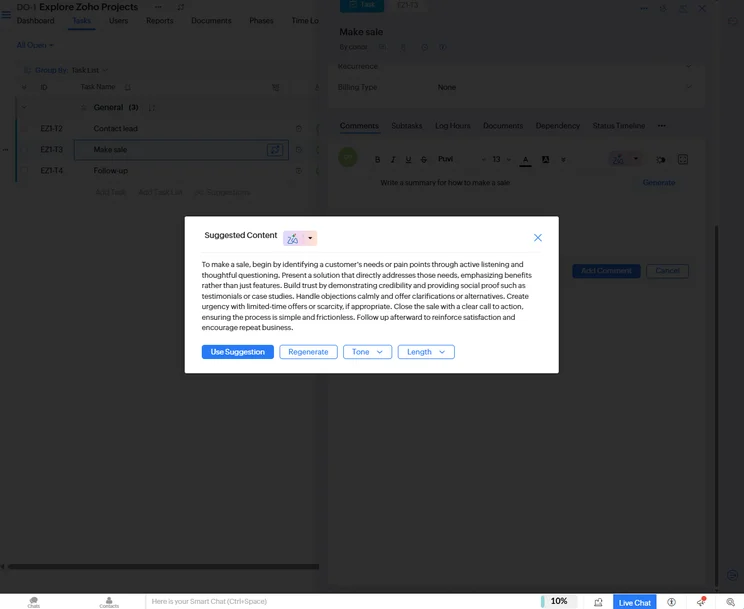
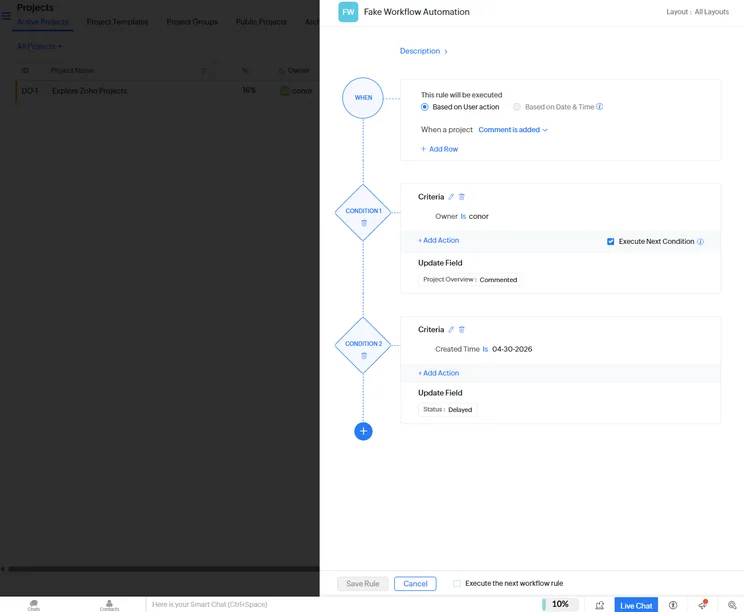
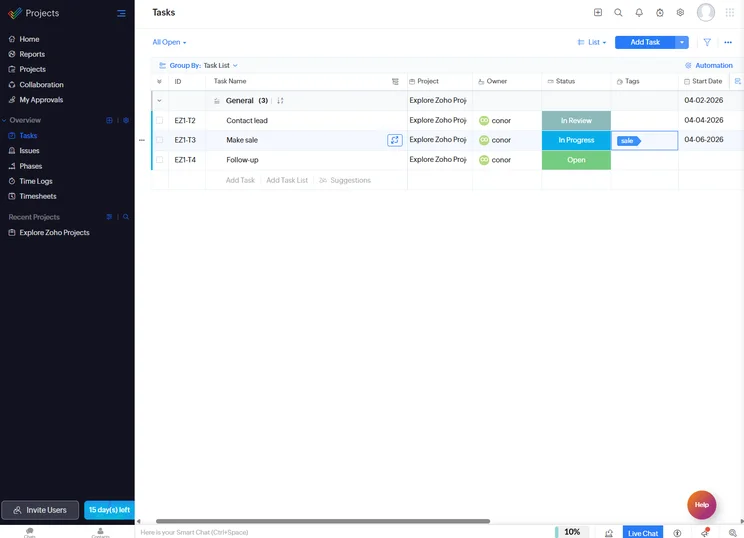
During testing, I found the Gantt chart on Zoho Projects especially easy to use. Compared with the straight lines of Teamwork and ClickUp, Zoho opts for a less formal and more rounded design, which could very well be more appealing to certain users.
Zoho will add all of the information you’ve already inputted into its software, straight into your Gantt chart. For businesses that want to avoid re-inputting data over and over, Zoho is a great choice.
Zoho is one of the providers featured in this article that lets you draw your own task dependencies on the Gantt chart, which will help you understand your project’s critical path and make informed decisions on what your business should and shouldn’t prioritize.
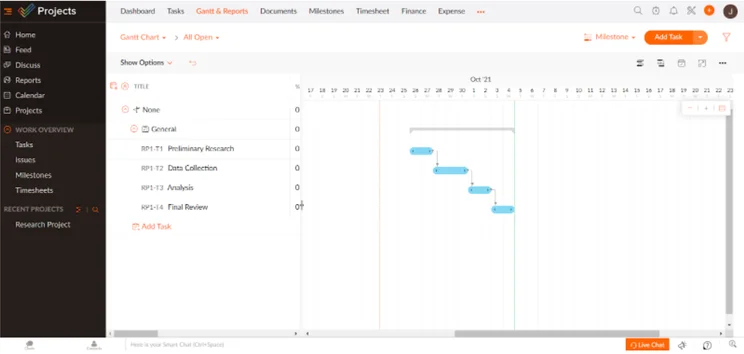
Our senior researcher, James Macey, testing out the Zoho Projects Gantt chart. Source: Tech.co testing
Zoho Projects’ additional features
Zoho Projects is a great option for businesses that don’t want to break the bank. It has a very decent free plan, and its paid plans start at a very respectable $4 per user, per month.
With a wealth of integration options, it can be scaled up to your liking, and business can create a centralized platform that has all of their software needs. Similarly, if a Gantt chart isn’t enough, Zoho Projects offers a Kanban board and spreadsheet-like view.
Zoho Projects pricing
If you’re a fan of simple pricing structures, Zoho Projects is the provider for you. Remember, compared with some of the other vendors on this list, Zoho Projects is incredible value for money.
Here are the plans available with Zoho Projects:
- Free: Three project limit, whiteboard, subtasks, 5GB storage, five user limit. Well suited for very small teams, particularly as you can’t add guests.
- Premium ($4 per user, per month): Unlimited projects, project templates, time tracking, Zia AI Insights, blueprints. Great for the average small team wanting a platform they can rely on.
- Enterprise ($9 per user, per month): Zia AI Search, Zia AI Translation, custom fields and status, custom roles and profiles, single sign-on, read-only users, two-factor authentication. Ideal for large businesses carrying out a diverse mix of projects.
- Ultimate ($14 per user, per month): 15GB storage per user, 100 read-only users, 100 resources, 500,000 workflow executions/month, multi-user & multi-project timesheets. Ideal for enterprises carrying out complex operations.
- Projects Plus (custom pricing): Zoho Projects, Zoho Sprints, Zoho Analytics, Zoho Workdrive. Perfect for enterprise-level businesses seeking a whole operational solution.
4. Jira: Best Gantt Chart for Data Visualization
Gantt chart on free plan? Yes (but only milestones, not tasks)
Auto-populates Gantt chart? Yes
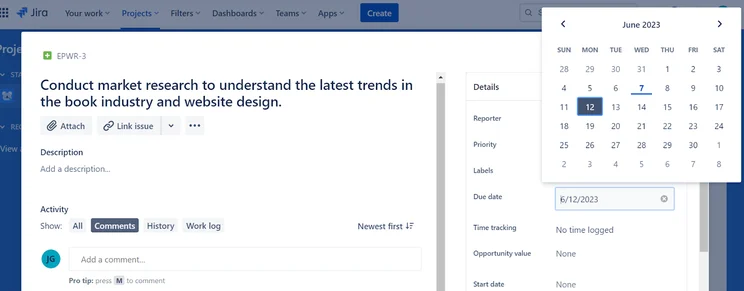
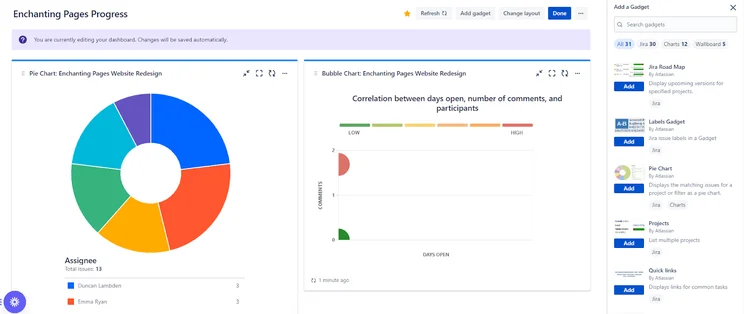
Jira is another great option if you want to make Gantt charts for free – but it does much more than that. One of Jira’s strengths, for instance, is its data visualization tools, which are all available on all of Jira’s plans. That means you’ll have both preset and custom charts at your disposal without paying anything, as well as a number of widgets.
Jira

In Short
-
Pros
- Single sign-on available on all plans
- Excellent value for money
- Custom automation available on free plan
-
Cons
- Lots of tech/dev jargon
- Integrations can be confusing
- Not the best for collaborating
Pricing
-
 Free plan available
-
Standard: $9.05/user/month
-
Premium: $18.30/user/month
Images
Why we like Jira’s Gantt charts
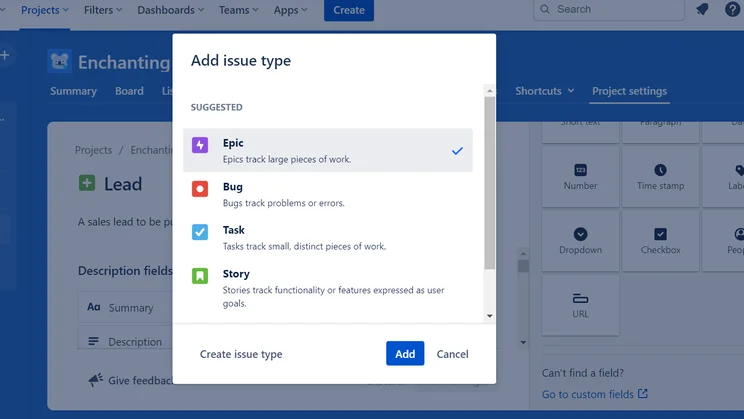
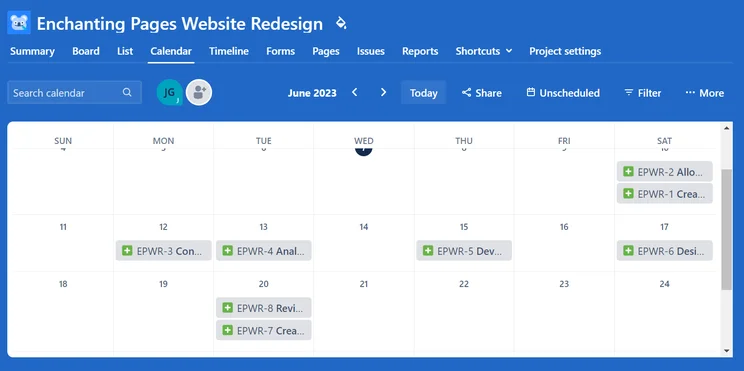
Businesses should note that Jira provides a ‘Roadmap’ view which enables you to view projects as a Gantt chart. The price of these roadmaps depends on how complex your project is and the number of people you have working on it.
- Strong timeline visualization: This allows teams to visualize the timing, duration, and dependencies of specific tasks within a project. Jira will let you map dependencies in our team to account for any potential project blockers, and keep your teams and stakeholders in sync.
- Simple date shifting: Jira’s Gantt charts will automatically adjust dates for all dependent work, when tasks and deadlines are changed or added.
- Gantt chart plugin: If your business is looking for powerful Gantt chart features, Jira offers a plugin known as WBS Gantt-Chart. This gives users the options to drag-and-drop elements, allocate resources, and visualize any roadblocks or issues hierarchically. While this is a useful add-on, it’s only free for up to 10 users, and many of the other providers on our list will provide these features as part of their original package and without additional payments.
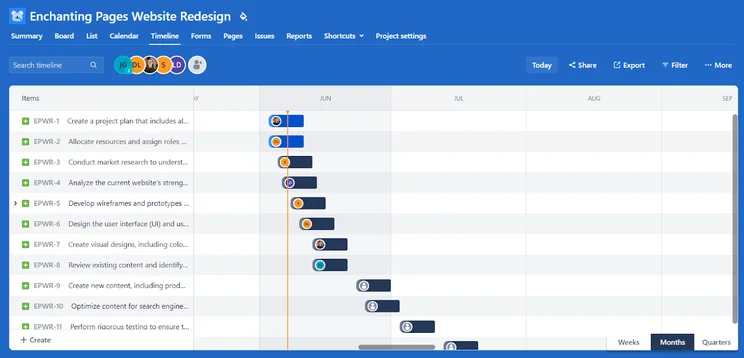
In Jira, a Gantt chart is known as a ‘Roadmap,’ in which ‘Epics’ can be tracked. Source: Tech.co testing
Jira’s additional features
Like we said, Jira is very generous with its data visualization tools, which are available on all of its plans, including its free plan. It integrates with popular messaging apps, as well as some of the software development platforms that we’ve mentioned above.
Although Jira has one of the cleaner user interfaces in the project management world, you can sometimes get lost in its menus and you can end up spending quite a lot of time menu-diving that could be spent elsewhere. But all things considered, it’s an excellent piece of software that does a bit of everything.
Jira pricing
Here are the plans available with Jira. The prices below are based on a team size of 100 users, with costs paid monthly:
- Free: Data visualization tools, workflow creation features, 2GB of storage, 100 automations per month, unlimited users, unlimited projects. Solid free option for small teams.
- Standard ($9.05 per user, per month): 250GB storage, 1,700 automations per month, AI features, up to 100,000 users per site, external collaborations, user roles and permissions. Great choice for businesses managing data-heavy projects.
- Premium ($18.30 per user, per month): Cross-team planning and dependency management, customizable approval processes, unlimited storage, 24/7 support, 1,000 automations per user per month, Atlassian AI Intelligence. Ideal for larger teams with many users.

Struggling to Juggle Tasks and Meet Deadlines?
Project management software can help
5. monday Work Management: Most Customizable and Visually Appealing Gantt Chart
Gantt chart on free plan? No
Auto-populates Gantt chart? Yes
monday work management is the best project management software we’ve tested here at Tech.co — it has absolutely everything you need to run a successful project from multiple locations.
The provider excels when it comes to customization and will let you exert a lot of control over the planning of your projects. Jess, a campaigns executive who uses monday work management, said of the experience: “Items are easy to create, and being able to move the order of tasks is very useful.”
monday work management

In Short
-
Pros
- Robust automation features
- Built-in AI tools for workflows and note taking
- Extremely customizable
-
Cons
- Free plan has 2-person user limit
- Strict AI credit limits
- Can get expensive with high AI usage
Pricing
-
 Basic: $9/user/month
-
Standard: $12/user/month
-
Pro: $19/user/month
-
Enterprise: Custom
-
Free plan available
-
14-day free trial
Images
Why we like monday work management’s Gantt charts
Unlike the other providers on this list, the monday work management platform only gives access to Gantt charts via its paid plans.
All you need to do to create a Gantt chart in monday work management is add the Gantt chart view to your project, which only takes a couple of clicks, and your tasks will appear without you have to type them all in and organize them.
By clicking the ‘Baseline’ option in your Gantt chart view, you’re able to easily customize what information your chart includes. You can edit how projects are grouped, labelled, and what color they take on in the chart. Options like critical path are also available in Beta.
monday work management is one of the best looking project management software options out there, and its Gantt chart is no exception. And, with advanced visual settings, you can organize your chart exactly as you like it.
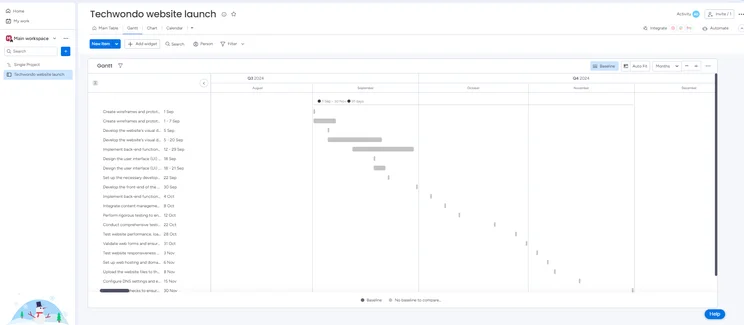
Viewing a Gantt chart in monday work management. Source: Tech.co testing
monday work management’s additional features
Simply, monday work management is our top choice of project management software. It’s a great all-rounder — really easy to use, good value, good free plan, feature rich, and stacked with integrations. Like everything on monday work management, building a Gantt chart is easy.
There are lots of team collaboration features, including a dedicated resource management chart that lets you track every team member’s workload, and an inbox for project communications. This feature is particularly useful for managers with several employees reporting into them, as it can give you oversight of who is overburdened and who might have more capacity.
monday work management pricing
Here are the plans available with monday work management:
- Free: Two user limit, Kanban boards, custom fields, dashboards, widget builders. No onboarding assistance or phone-based support. Ideal for individuals or very small teams.
- Basic ($9 per user, per month): Unlimited free views, unlimited items, 5GB storage limit, prioritized customer support, no Gantt charts. Best for small teams managing simple projects.
- Standard ($12, per user, per month): Guest Access, Comms and CRM integrations, custom automations, Gantt charts, 250 automation actions per month, 250 integration actions per month. Best for collaborating and optimizing a team project.
- Pro ($19 per user, per month): Private boards, time tracking, 25,000 automation actions per month, 25,000 integration actions per month. Ideal for bigger teams dealing with more complex projects.
- Enterprise (custom pricing): Portfolio management, resource management, enterprise-scale automations and integrations, advanced reporting and analytics. Best for enterprise-level organizations.
Buying Guide: How to Choose a Gantt Chart Provider
Here’s our two cents — it’s much better to go for an all-round great project management tool than to look for a Gantt chart provider specifically. Luckily, almost all project management software programs offer some sort of Gantt chart feature — and many of them are pretty similar.
Therefore, we’ve outlined a few things to consider when choosing the right Gantt chart provider:
- Price: How much would you like to pay for project management software? Businesses on a budget can take advantage of a feature-rich free plan, such as ClickUp, but if a little more functionality is needed, Zoho Projects is a great option at only $4 per user, per month.
- Chosen plan: Not all providers offer a Gantt chart on every plan, like monday work management, so if a Gantt chart is what you need, make sure you choose a plan that includes one.
- Team size: More often than not, project management software plans will have limitations on how many users can use its service. So, making sure you choose a plan that allows for the number of people on your team is essential.
- Additional features: A Gantt chart can be limited in its view, so if your business is looking to make the most of features other than a Gantt chart, check to see what these are with each provider and plan. monday work management, for example, offers Kanban boards and spreadsheet views, as well as Gantt charts.
- Gantt chart plugin option: Some providers, like Jira, have a specific Gantt chart plugin rather than being widely available on the platform. While you can use Jira’s Gantt chart plugin, WBS, for free up to 10 users, you’ll have to add another monthly cost if wider access is needed.
- Automatic or manual data entry: Does your Gantt chart already come loaded with all the data you’ve already put into your project management software or do you have to re-input it all yourself? Luckily, most providers will automatically transfer over your project data onto a Gantt chart, but this is still something to be aware of.
- Appearance: What a Gantt chart looks like can have a big impact on how project information is understood. Options like monday work management and ClickUp present information in a sleek and simple way, and give your team plenty of customization options to make sure all project updates are presented in a preferred way.
- General functionality: Intuitive project management software options, like ClickUp and Teamwork, will offer options such as drag-and-drop functionality to make your Gantt chart easy to interact with. How your Gantt chart works is crucial, especially if your business is new to project management software, and would like a platform that operates intuitive to human interaction with technology.
Gantt Chart Software vs Project Management Software
There are some places to get Gantt chart software for free – a cursory Google search will show you that there are several options out there. Some of these software include GanttPro and TeamGantt, both of which will provide solid Gantt charts for managing your project’s data, for free.
However, there are actually very few reasons to opt for dedicated Gantt Chart software over a broader project management software package, and here’s why:
There are plenty of free PM software packages
Many of the software packages mentioned in this article have free versions that let you create and use Gantt charts. This means can get your hands on the best Gantt charts out there without paying a single cent.
Additional project management features
If you need Gantt chart for your project, we have a funny feeling you may find some other project management tools handy too. With project management software like ClickUp, you’ll have Gantt charts and much, much more at your fingertips — a luxury you won’t have with basic Gantt chart software.
Customer support
Generally, the customer support you’ll receive from a multinational project management software company will be markedly better than what you’ll receive from a free Gantt chart provider website.
How Can a Gantt Chart Help my Business?
Gantt charts are an incredibly useful visual tool for project managers working on all sorts of projects. It’s the sort of tool that busy project managers will find beneficial because they won’t have to spend precious time reiterating project plans or how much progress has been made.
If used within project management software, for instance, it can provide all team members with the most up-to-date state of affairs. Indeed, Gantt charts will help your business in a number of ways, including:
Make workflows more efficient
What’s more time-consuming than employees who don’t know what’s going on, and need to have every little aspect of a given project re-explained to them? Very little, in business terms. Gantt charts will save you time through the creation of a clear project roadmap everyone can look at.
Accurate forecasting
There’s nothing more demoralizing than being set an unrealistic deadline — this can happen if you set one way too soon, or too far in the future. Gantt charts will aid with the creation of realistic goals and deadlines, simply because you’ll have all the information laid out in front of you.
Methodology: How We Test Gantt Chart Software
At Tech.co we don’t write about products and services without conducting thorough research, and hands-on testing where applicable. While this process can be time consuming, it’s time well spent if it means we’re providing better, more useful information for your business.
When it comes to project management software, we test out each program first-hand, guided by an in-house research framework consisting of six core assessment areas that break down into a range of smaller subcategories. This framework is based on the factors companies and project managers have told us are important to their everyday usage. The six criteria are:
- Ease of use: After getting five to six participants to test each project management software for an hour, we assessed how easy it was to set up a project with the platforms, how clear their interfaces were, and how easy they were to navigate.
- Pricing: We look at all plan costs. Providers offering lots of features for lower costs will have better pricing scores than those that lock them away on higher-tier plans.
- Customer support: We assess the ways you can contact your project management software provider if something goes wrong. Providers offering 24/7 live support, as well as phone-based support and onboarding assistance, get the best scores.
- Security: For this area, we assess the security options offered by each provider. This includes user-level security features like two-factor authentication, as well as more administrative security measures like user permissions and IP restrictions.
- Integrations: We assess the quantity — and the quality — of the applications each project management software provider integrates with.
- Functionality: This part of our research involves assessing the full feature set that each product provides. We look at four function-based sub-categories as part of this, including task management, project and workflow creation, data visualization, and collaboration.
It’s important to note that not all of these criteria hold equal weight in our testing methodology. This is best practice and based on what businesses have told us is essential, compared with what’s simply “nice to have”.
Because of their central importance to project management, how easy each tool is to use, how much it costs, features for project and workflow creation, and task management had more of an impact overall than other criteria.
Although it has faced stiff competition from the likes of Teamwork, ClickUp is the best Gantt chart software out there — largely because you don’t have to pay anything to use it and can gain access to loads of useful project management tools at the same time.
However, if you’d like an all-encompassing project management solution that will give you Gantt charts and much more — and you’re prepared to pay for quality — monday work management is the way to go. You can get yourself Gantt charts for less with ClickUp, of course, because monday work management doesn’t have a free plan, but it’s the best one overall.
FAQs
Yes! G Suite users have the capacity to create Gantt charts in apps like Google Sheets. However, although Google Workspace can be used successfully to manage projects, opting for project management software that includes Gantt charts will be a lot more conducive to project success. If dedicated software exists for a specific use case (e.g. managing a project), it’ll almost always be better option for you than broader business software.
On Windows, although Excel doesn’t have an existing Gantt chart type, you can create one using a free Gantt project planner template for Excel. On MacOS, on the other hand, you can simulate one by customizing a stacked bar chart to show the start and finish dates of tasks, like this. It’s doable, but it’s just not as easy as it is when using project management software like monday work management.
The honest answer is that really, it depends on what you’re planning. PERT charts and Gantt charts are both commonplace in project management but achieve different aims – PERT charts are much better for viewing a project’s critical path and drawing dependencies between tasks, as well as general big picture planning — Gantt charts are a much easier way to visualize project progress once a project is underway.
If you click on, sign up to a service through, or make a purchase through the links on our site, or use our quotes tool to receive custom pricing for your business needs, we may earn a referral fee from the supplier(s) of the technology you’re interested in. This helps Tech.co to provide free information and reviews, and carries no additional cost to you. Most importantly, it doesn’t affect our editorial impartiality. Ratings and rankings on Tech.co cannot be bought. Our reviews are based on objective research analysis. Rare exceptions to this will be marked clearly as a ‘sponsored’ table column, or explained by a full advertising disclosure on the page, in place of this one. Click to return to top of page


